FMP: Project Summary
- Fisnik

- Mar 31, 2020
- 4 min read
Project Title: Digital Omniscience Interface [WIP]
Brief Overview:
Explore Surveillance Capitalism and the techniques employed to gather data. Expose these through an engaging way.
[Definition]Surveillance Capitalism: A form of capitalism, using technology for its purposes. Providing free services that monitor user’s behaviour, often without their consent. The user’s personal info is commodified by a business claiming their experience as a free raw material they can use to predict how the user will behave in the future.
Steps taken so far:
Key reading/research: Shoshana Zuboff – The Age of Surveillance Capitalism
I have begun wireframing the interface for my digital omniscience. See images.
I have started using Unity to design the space.
My response to the brief:
A Digital OmniscienceInterface (also using Unity to visualise data)– The State of Knowing everything, in this case, digital data collected about a user. This is what Surveillance Capitalists, such as Facebook and Google, aim to achieve. This is what I will show through my project/outcome.
Behind the idea:
Newly available data sources have dramatically increased the quantity and variety of data available. Therefore, increasing economies of scope: increasing the variety of data that can be collected. And increasing economies of scale: a lot of this different data can be collected. Zuboff’s argues this is what Surveillance Capitalism needs to flourish. Zuboff suggests that our emerging ‘sensor-based society’ will make surveillance capitalism more embedded and pervasive in our lives: It’s spreading widely throughout society and it may be unwelcomed by some.
What I Will Do: Self Ethnographic Research Approach
I will place my digital self at the centre of the project, exposing my real digital data. I will design my living space in Unity including all the ‘sensors’ which collect data. I will visualise these through Unity to show how the sensors communicate with each other, abstractly? [WIP]. The sensor data collected can be accessed through the interface by the user. The user can listen to recordings, view photos, view data from wearables etc. The user can then make an ‘inference’ about the data they have seen. This inference is about the person the data is collected from (me), for example, what advert for a product do they think I should see. This what behavioural algorithms already do in our devices.
Audience:
Exposing surveillance capitalism to an audience which may already have some idea about that type of data our devices are collecting about us, but don’t realise the extent at which this is happening. This will be backed up by primary research, a questionnaire, I will conduct.
What I really want to find out is whether people are aware of the different data sources and how surveillance capitalism can use them for its purposes. How sensors in our homes/life/bodies are collaborating with one another. This deep collaboration between algorithms and systems, which results in prediction programs being developed.
The Interface:
“Spaces can be aggregated into a seamless flow of searchable information, sites, and sounds in much the same way that Google once aggregated webpages for indexing and searching.” (Zuboff, 2019, page 209).
What Google did to world information:Datafication,Indexing,Browsing,Searching.
By using Googles technique of categorising and exposing all the words information, in my interface I could do the same, categorising and exposing the behavioural data gathered off an individual. This ‘seamless flow’ would represent the data algorithms in our devices working together to gather and understand behavioural data on us.
This idea expands from my IoT Surveillance Tool project in the Digital Design Portfolio unit. My outcome for that project was a prototype. A tool which aimed to expose what our IoT devices get up to. At the end of my presentation for this project, I said I could continue to develop the project by using AR to show how the devices in my home communicate which each other. During my data collection, I noticed that different devices communicated to the same ‘endpoints’. In a way, this project follows that up by visualising how different sensors are working together to collect data from us.
Idea Inspiration
The project mentioned in The Age of Surveillance Capitalism, page 208.
DoppelLab Project
Links:
This project uses Unity to visualise sensor data in a building.“Homes and offices are being filled with sensor networks to answer specific queries and solve pre-determined problems, but no comprehensive visualization tools exist for fusing these disparate data to examine relationships across spaces and sensing modalities.”

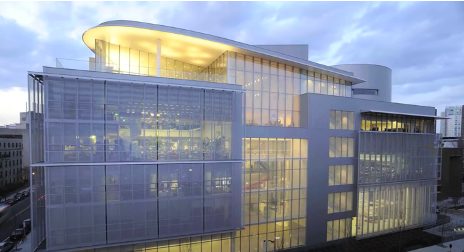

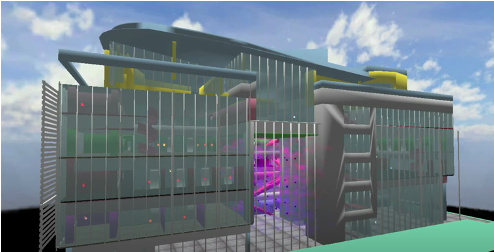
Photo of the real building where the sensor data was collected. This was designed into a 3D model through Unity. I would design my space in Unity.

This image shows an example of how DoppelLab visualised conversations happening in an area, to measure worker productivity. They visualised this through music notes. The more that appear, the more sound there is. This provides an easy way for users to see whether action needs to be taken.
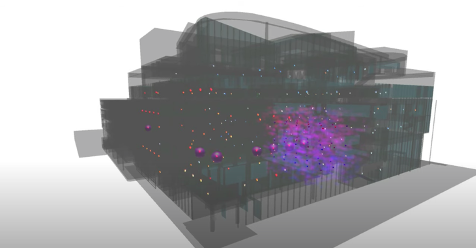

Images show how temperature data was being visualised.

For my project, I would need to think about how I could visualise the data collection from sensors in my space. So how can microphone data, visual camera data, data from wearables be visualised in Unity to show:
1) the amount of data being collected
2)how it may connect with other data


Comments