IoT Surveillance: Interface Development
- Fisnik

- Nov 30, 2019
- 3 min read
Updated: Jan 7, 2020
I started thinking about the design of my app. I liked the idea of having the camera fill the whole interface and then the AR appear once it detects the Hiro marker. But I also started to think of my app as a tool, just as the Princeton tool is advertised.
I designed my own icons (images below) which represent IoT devices and created a quick how-to guide, showing the user how they can use the app. I animated these icons using after effects but encountered may issues.
Since aframe restricted me to Firefox, as both were developed by Mozilla, the code would behave differently on different browsers. My animations exported as .avi files which couldn't be played on Firefox since the browser does not support .avi decoders, and exporting them as mp4s would include a black background in the video. This is something I need to continue working on and continue researching to find a solution. I put these part of the interface on hold for now, till I figure a way to fix these issues. In the meantime, I started developing the part of my system which communicated the data, but not through AR as I think this is still very important.
UPDATE: During the interim crit, I asked my colleagues if anyone know a solution to my issues. Many expressed they experience the same problem. I have now managed to sort out this issue with the help of Mai and Kasia. My animations not longer present any background. We were able to use a combination of Photoshop and After Effects to export the animation as a .gif file with no background

These gifs were to be used on my landing page through an automatically alternating carousel. They give the user a quick lesson on how to use the tool and what they can expect from it. From left to right: Image shows IoT devices connected to the home. Image shows how to scan a device and where to position the Hiro marker. Image shows the tool will have a privacy focus, with the shield protecting all the IoT devices whilst they are working in the background. Image shows data going in and out of the device and whether the device is currently secured HTTPS. Finally, the image shows how an unsecured device is represented, the bubble bursts and the data is left unexposed.
The images below are some wireframes showing how I was thinking about the design of the interface. When the name of the devices is tapped on, it expands to show the extra information that cannot be conveyed through AR.

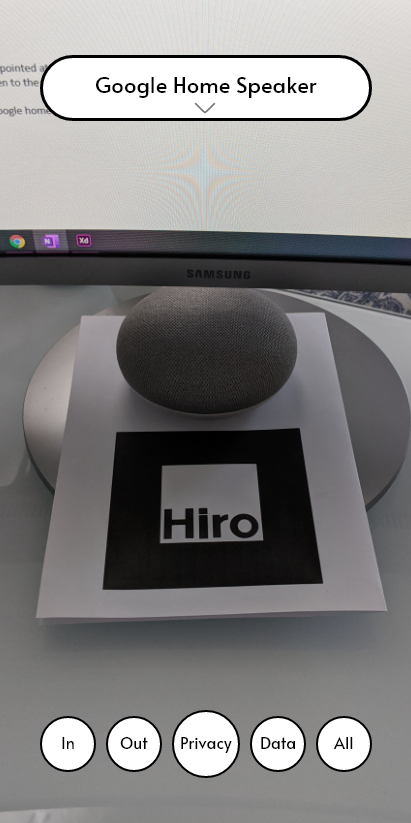

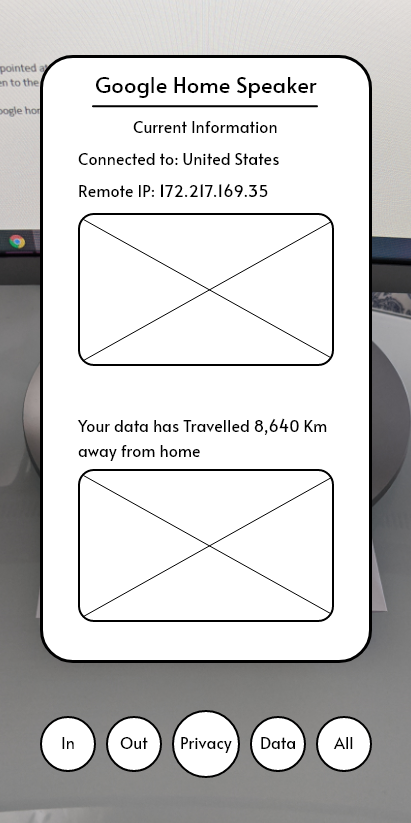


When the app detects the Hiro marker, it displays the data transiting through real-time. I was experimenting with what data I wanted to show, trying to decide what would be interesting to the user. Whether I should present the user with a map of where the data is going, I would find this out by tracing the IP.
I decided that I would keep the app privacy-focused, meaning the user would be shown where their data is travelling to, and what laws are protecting their data, depending on where they are going. This required research into different countries data protection laws, and finding an engaging way to present this in my app.
I began to brainstorm what the user would want to see. For example, the IP address may not provide any use as it's just arbitrary numbers, however, locating the IP in a map may give some more context with what's happening to their data. This is something existing tools do not do.
Interface Style Guide
Once I was comfortable with my wireframes, I developed the style guide for my app. I aimed for a uniform look which would present a cohesive look between all the elements, the iconography and website design.

Incorporating the style


Then I had incorporated the style in my wireframes. I was happy with the result however felt maybe I could design the first page differently as the curved rectangles seem a bit too big in my opinion and there is quite a bit of whitespace.


Comments