Digital Omniscience Data & Research
- Fisnik

- Apr 6, 2020
- 3 min read
Updated: Apr 25, 2020
I began generating low fidelity wireframes to stimulate ideas on how I would like the interface to look, what sections it needs, and possible interactions. Before I started this, I noted down the different types of data collected on myself I have access to. these include:
Motion images captured by CCTV cameras
There is a vast amount of underlying information available from this type of data. users can see what I am wearing, therefore make inferences of my fashion sense. Furthermore, date and time stamps are available which also leaves to interpretation what I get up to during my days. This data can be combined with Google Timeline data to show where I am travelling to.
Microphone sound recordings
When using voice assistants, Google Assistant, the sound recordings are saved and stored. I can download these from my Google account activity dashboard and include them as data. This will give the user an insight into what I am searching for through Google.
Browser history
This works similarly to the voice assistant saved recordings.
Phone activity
Zuboff argues that the data algorithms in our devices are designed to be deeply undetectable. they can tell what apps we use, how long we use them for. Since I used a Google phone, the Google activity dashboard logs all this data, showing what apps I am using, at what times and for how long. This data is really valuable to show as it shows my online habits tied with how I spend my day.
Wearable data
I use my watch to measure my heart rate and my workout routine. My watch is branded as a sporting/activity therefore it has many capabilities of recording specific data. As well as measuring and storing my heart rate, it measures my sleeping efficiency, steps taken in a day, stress level as well as other data I willingly provide such as how much water I drink, how my weight fluctuates. This is a perfect data source for data that is really personal to an individual. Showing this in my interface would provide that deep connection between the data and the algorithms access to it to make inferences about us.
Below I have included some example of the data I have discussed above.
Motion images captured by CCTV cameras:
Possible inferences:
I like wearing Nike shoes.
I wear Cyberdog clothing on most days.
I like wearing caps.
I usually wear dark coloured clothing, however, I'm not afraid to spice it up with a bit of colour...
Yellow is my favourite colour?
I wake up early on most days.
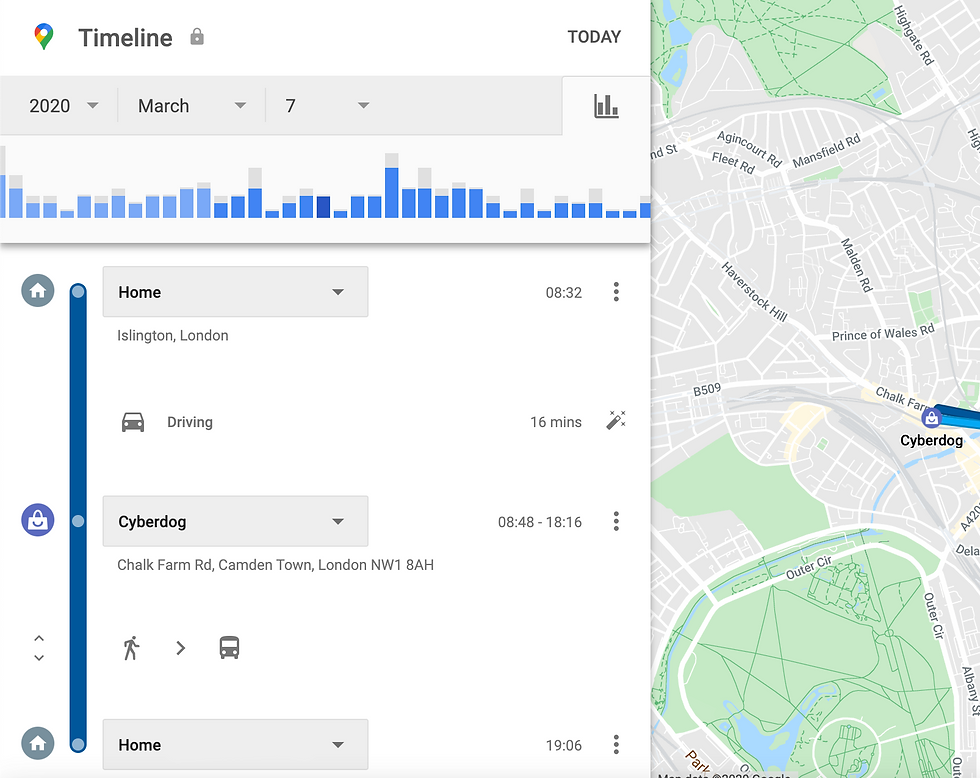
Google Timeline data:

Possible inferences:
I like shopping at Cyberdog (since I spent 9 hours there)
I work at Cyberdog (since I spent 9 hours there)
Took a taxi to Cyberdog?
Wearable Data:
Possible inferences:
I don't get the recommended hours of sleep for my age
Smartphone activity data:

After I received feedback from my questionnaire, I noticed that the categories I was using in my project; camera, activity, microphone and wearables, didn't require only showing data from a camera. For example, I was thinking of camera only as CCTV. But this could actually be photos the subject has taken and stored in their cloud photo storage. This could also be Instagram posts they are tagged in. Furthermore, microphone data doesn't only have to be from smart speakers which store the sound recordings in the cloud. This could also be the sound heard in a video they record on their phone. Using this technique of categorising the collected data may result in deeper inferences being made.


Comments